Just back from break, seem like a good one, or else will be whipped more by the mkt.
I am not entirely bullish but the sideways consolidation can be a likely scenario for the next thrust. Market can consolidate through correction or time and it is doing the latter in many sectors.
In the events we are going to break, here are a few for breakout play. But as always watch your risk, especiallly a failed breakout, :)
Straitsasia
Goldenagri
Pac Andes
Olam
Wilmar
Ho Bee
Wingtai
Allgreen
UIC
I am thoroughly disappointed during these few months, although i am still up 77% average for the year on all my accounts. And to continue research in a systematic way, i should put up what I am going to do in scrutiny of my very few readers..
1. To read 1 book a month if i can get my hands on
Frost, A.J. and Prechter, Robert R., Elliott Wave Principle, Tenth Edition
Edwards, Robert D. and Magee, John, Technical Analysis of Stock Trends, 9th Edition
Kaufman, Perry J., New Trading Systems and Methods, 4th Edition
Kirkpatrick, Charles D. and Dahlquist, Julie R.: Technical Analysis The Complete Resource for Financial Market Technicians, Pearson Education
Nison, Steve, Japanese Candlestick Charting Techniques, 2nd Edition
Pring, Martin J., Investment Psychology Explained
Pring, Martin J.: Technical Analysis Explained, 4th Edition
Aronson, David R.: Evidence-Based Technical Analysis
2. For those aspired TAs who want to win buy and hold, win this game first http://www.chartgame.com/ Don't say not enough indicators or can only buy/sell on closing/opening. Beat it.
3. To do quant testing on market
- I am not that keen on above as there are numerous resources out there that can do a better job than me, the only disadvantage is that lack of such data in sg.
Wednesday, December 2, 2009

Sunday, November 8, 2009
Shorts
With Dow cycle projected around 10,374, we might have around 7-8days of uptrend to work with:
Longs
Guocoland
SMRT
Noble - 2nd day consolidation, 3rd day decide
UOB 18.22
Ezra 2.00
rotary 1.10
wingtai 1.73
Wednesday, November 4, 2009
Continue Observations
Mar- Jul Breath & Vol goes in hand. Overbought get overbought. Oversold with fierce rallies Chart formation work best: bullflap, ascending, flat consolidation breakout
Aug - Sep Vol goes to pennies, high for many stocks achieved. Short of failed breakout have to wait 1day Momentum trade for the pennies (which i got to learn, especially those breakout for 2-3days pennies)
Oct - Nov Where shall it be? Oversold get oversold? Overbought with fierce selldown?
Uptrend line breakdown seem to be slower than flat consolidation breakdown (when it flip it upside down, u get it)Weak get weak, strength beget strength
Friday, October 23, 2009
Breakout list
Financial One - 0.50
Macarthurcook industrial -0.42
Sinwa - 0.52
Super coffeemix - 0.675
biosensors??
Engro - 0.91 hmm...
longtime never see this list rite.ya.. small size
Macarthurcook industrial -0.42
Sinwa - 0.52
Super coffeemix - 0.675
biosensors??
Engro - 0.91 hmm...
longtime never see this list rite.ya.. small size
Tuesday, October 20, 2009
Largest % rally in STI without correction
Classifiy them as huge range
Apr 1990 - 1109 - 41%, 13mths
May 1991 - 1565
Oct 1992 - 1333 - 77%, 4 mths
Feb 1993 - 2366
Nov 2001 - 1332, 35%, 4mths
Mar 2002 - 1801
1998 rebound rally
===============
Aug 1998 - 862 - 79%, 5mths
Jan 1999 - 1547
Correction of (1504-1362) - 10%, 1mth
Feb 1998 - 1362 - 60%, 5mths
Jul 1999 - 2175
=================
Bull market 2003
=================
May 2003 - 1300 - 44%, 12mths
Feb 2004 - 1884
Correction of (1895-1700) - 11%, 1-2mths
May 2005 - 1700 - 56%, 12mths
May 2006 - 2659
Correction of (2659-2367) - 13%, 1-2mths
Jun 2006 - 2367 - 55%, 12mths
Jul 2007 - 3635
*slight correction at on Feb07
Correction of (3633-3322) - 9%, 1 mth
Jul 2008 - 3635 - 7%, 3mths
Oct 2008 - 3900
Notice something very interesting, % of gain, mths, correction move in unison until the last rally breaks the trend
=================
Mar 2009 - 1440, 87%, 7mths
Oct 2009 - 2700
Number besides is % gain, number of mths achieved, eyeball test, by definition of correction means 10% from the high.
Apr 1990 - 1109 - 41%, 13mths
May 1991 - 1565
Oct 1992 - 1333 - 77%, 4 mths
Feb 1993 - 2366
Nov 2001 - 1332, 35%, 4mths
Mar 2002 - 1801
1998 rebound rally
===============
Aug 1998 - 862 - 79%, 5mths
Jan 1999 - 1547
Correction of (1504-1362) - 10%, 1mth
Feb 1998 - 1362 - 60%, 5mths
Jul 1999 - 2175
=================
Bull market 2003
=================
May 2003 - 1300 - 44%, 12mths
Feb 2004 - 1884
Correction of (1895-1700) - 11%, 1-2mths
May 2005 - 1700 - 56%, 12mths
May 2006 - 2659
Correction of (2659-2367) - 13%, 1-2mths
Jun 2006 - 2367 - 55%, 12mths
Jul 2007 - 3635
*slight correction at on Feb07
Correction of (3633-3322) - 9%, 1 mth
Jul 2008 - 3635 - 7%, 3mths
Oct 2008 - 3900
Notice something very interesting, % of gain, mths, correction move in unison until the last rally breaks the trend
=================
Mar 2009 - 1440, 87%, 7mths
Oct 2009 - 2700
Number besides is % gain, number of mths achieved, eyeball test, by definition of correction means 10% from the high.
Wednesday, October 14, 2009
Market Reviews
Didn't know I didnt blog for 2 weeks, was gathering research since market was flat, now that range extension has taken place, topping process continue.. now i sound like a broken record... haha...
Previous resistance was at 2750, but there is a higher chance we will hug the previous broken uptrendline for a blow-off. The soonest we touch that line, we had it.
Long
Guocoland (bear flap, buying on RSI, gap 2.16)
Indo (valid for blow off above 1.80)
Noble (gunning for all-time intraday high of 2.70)
Wilmar (nice consolidation, gap at 6.75)
Ezra (vol??)
hi-p (breakout)
Suntec (breakout)
Yzj (look like shorting covering today, and of course, becos if shorted it, see how consolidation)
Short list:
Capland (only valid tmr for a gapup of more than 5cents)
Olam (going for a blow off hugging uptrendline, ard 2.80)
Rotary (Short above 1.20, cover old high)
Parkway
set your own stop
Thursday, October 1, 2009
Market Reviews
Market has been range-bound for the couple of mths, make me probe about the possible change of strategy, previously strategy works well if I do really religiously follow it
My own P&L equity curve serves me as the best indicators, when breakout failed, mostly we are profit taking or range-bound. When short setup failed, most likely still in period of consolidation. But just a summary to what going on now:
Mar- Jul
Breath & Vol goes in hand
Chart formation work best: bullflap, ascending, flat consolidation breakout
Aug - Sep
Vol goes to pennies, high for many stocks achieved.
Short of failed breakout have to wait 1day
Momentum trade for the pennies (which i got to learn, especially those breakout for 2-3days pennies)
Oct -
Where shall it be?
Uptrend line breakdown seem to be slower than flat consolidation breakdown (when it flip it upside down, u get it)
I am working on a set of indicators to determine the market strength on which phase we are in.
1. Z call
2. STI weekly chart - above 10EMA
3. STI component charts - number of stocks above 20EMA
4. Breath of stocks- which i am still thinking how many days should i put
Alright pls comment though i guess most of you will be more interested in what is below:
Shorts:
Capitaland: 3.72 (should at least threaten the previous low at 3.50)
Swiber: 0.92
Kepland: 2.82 (shorted too early, this should be the price)
Olam: 2.50
Ho bee: 1.50
Ezra:1.95
Sembmar: 3.20
Ausgroup: 0.74
First target of STI- 2,580, 2500
by now should know the number besides is the cutloss pt, entry is only useful for determine your risks
Thursday, September 17, 2009
Market Reviews
Prop are joining the banks nearing uptrendline. But the most troubling thing for any correction will be US continuing strength in breath and adv-decline.
went on too short when shuld just apply the strategies mapped a while ago.
stops
DBS - 13.20 (trendline), 13.00 (breakout pt)
Yangzijiang - 1.06
Chinaaoil - 1.23
http://www.tradersnarrative.com/the-mother-of-all-momentum-thrust-years-2998.html
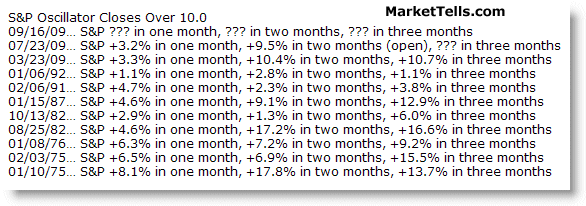
http://www.kirkreport.com/09/sp_oscillator_9_17_09.gif
http://www.kirkreport.com/09/battleforsept.gif
went on too short when shuld just apply the strategies mapped a while ago.
stops
DBS - 13.20 (trendline), 13.00 (breakout pt)
Yangzijiang - 1.06
Chinaaoil - 1.23
http://www.tradersnarrative.com/the-mother-of-all-momentum-thrust-years-2998.html
http://www.kirkreport.com/09/sp_oscillator_9_17_09.gif
http://www.kirkreport.com/09/battleforsept.gif
Monday, September 7, 2009
Market Reviews
As much as I am downside bias, I will give doubt to a "triple top" in the STI. Time is running out for the bears, it has to show this week or breakout to 2,750 will be the likely case.
Shorts -Sectors that are shortable if breakdown
Commodities (surprised, surprised, where the inflation talk)?
Banks
China
Long
Properties
hyflux
hyfluxwater
sarin - only valid tmr
sinotel
last note: in the event we break pass 2700, i will fade the strength
Monday, August 31, 2009
Market Reviews
I will still maintain the same strategies as mentioned in previous posts unless change of trend is quite clear
prop still look pretty ok with no serious damage, a few lower lows, rest of sectors look neutral
Shorts:
All 3 banks testing uptrend line
chinaaoil - i love to short this guy, but range it first
Commodities look weak - indo, i choose straits but the cutloss is too far
Sembmar still look gd as a short with 3.2 as cutloss
Longs
epure - waiting for tick up
hyflux - see how it how 2.80
singtel at 3.06 on valid tmr
genting - see how this guy hold 0.995
ho bee - see how 1.30
Subscribe to:
Posts (Atom)


 Posts